
Logging
Mandala provides comprehensive logging for all workflow executions, giving you complete visibility into how your workflows run, what data flows through them, and where issues might occur.
Dashboard
Before drilling into individual logs, the workspace Dashboard page gives you an at-a-glance view across every workflow: a per-workflow success-rate/cost timeline chart, aggregate execution counts, and a workflow list you can filter by trigger type or time range — the fastest way to spot a workflow that started failing or spiking in cost without opening the Logs page at all.
Logging System
Mandala offers two complementary logging interfaces to match different workflows and use cases:
Real-Time Console
During manual or chat workflow execution, logs appear in real-time in the Console panel on the right side of the workflow editor:
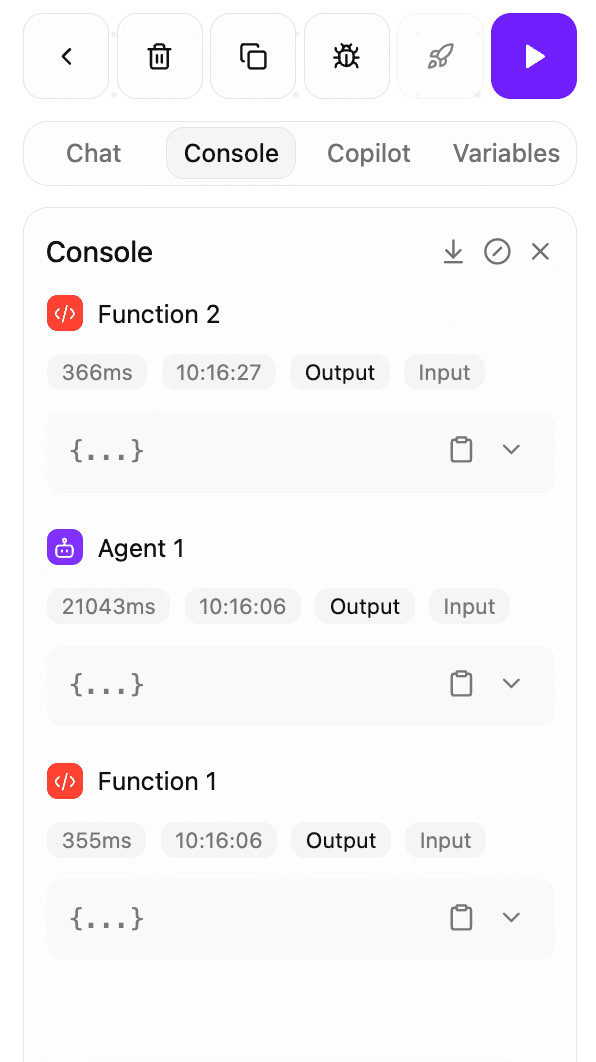
The console shows:
- Block execution progress with active block highlighting
- Real-time outputs as blocks complete
- Execution timing for each block
- Success/error status indicators
Logs Page
All workflow executions—whether triggered manually, via API, Chat, Schedule, or Webhook—are logged to the dedicated Logs page:
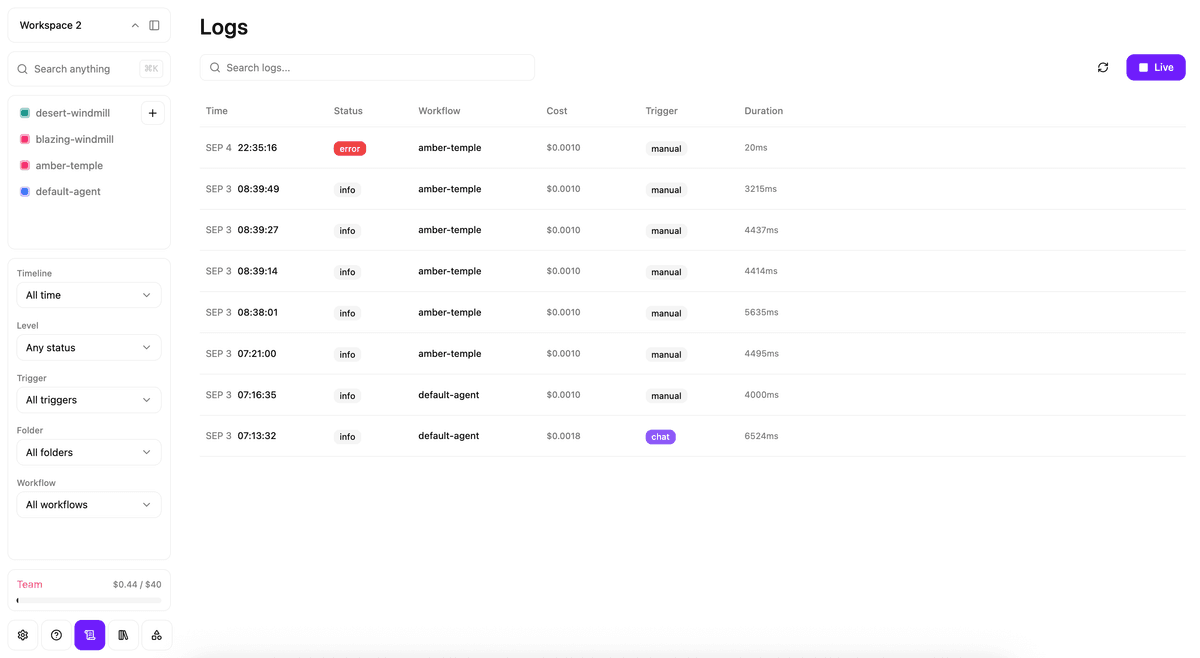
The Logs page provides:
- Comprehensive filtering by time range, status, trigger type, folder, and workflow
- Search functionality across all logs
- Live mode for real-time updates
- 7-day log retention (upgradeable for longer retention)
Log Details Sidebar
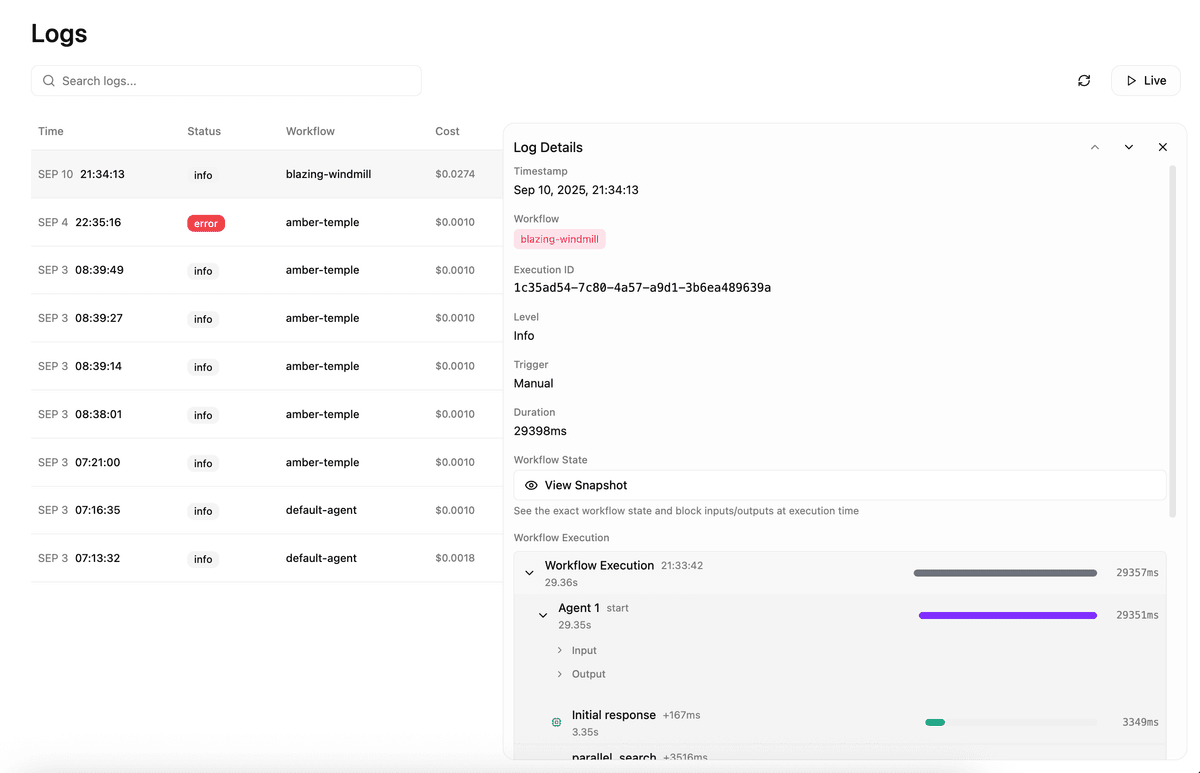
Clicking on any log entry opens a detailed sidebar view:
Block Input/Output
View the complete data flow for each block with tabs to switch between:
Output Tab shows the block's execution result:
- Structured data with JSON formatting
- Markdown rendering for AI-generated content
- Copy button for easy data extraction
Input Tab displays what was passed to the block:
- Resolved variable values
- Referenced outputs from other blocks
- Environment variables used
- API keys are automatically redacted for security
Execution Timeline
For workflow-level logs, view detailed execution metrics:
- Start and end timestamps
- Total workflow duration
- Individual block execution times
- Performance bottleneck identification
Workflow Snapshots
For any logged execution, click "View Snapshot" to see the exact workflow state at execution time:
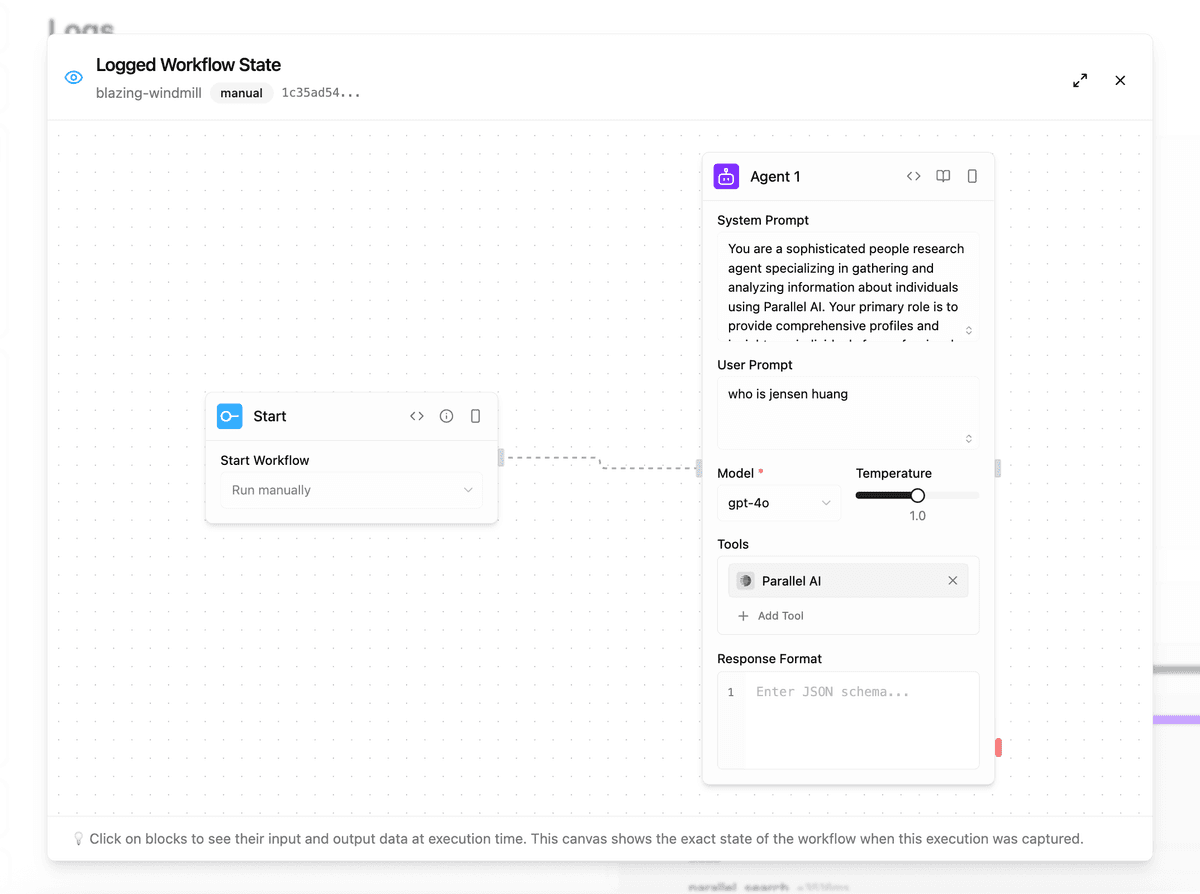
The snapshot provides:
- Frozen canvas showing the workflow structure
- Block states and connections as they were during execution
- Click any block to see its inputs and outputs
- Useful for debugging workflows that have since been modified
Workflow snapshots are only available for executions after the enhanced logging system was introduced. Older migrated logs show a "Logged State Not Found" message.
Notifications
Beyond watching the Logs page yourself, you can have Mandala tell you when something happens. Open the Notifications control in the Logs toolbar to create a subscription that sends alerts over webhook, email, or Slack — see the External API's Webhook Subscriptions section for the webhook payload/header format.
Each subscription can filter by log level and trigger type, optionally scope to specific workflows, and attach an alert rule so you're notified on a real signal instead of every single execution:
- None — notify on every matching execution
- Consecutive Failures — after N failures in a row
- Failure Rate — when the failure percentage exceeds a threshold within a time window
- Latency Threshold — when a single execution exceeds a duration
- Latency Spike — when an execution is slower than the recent average by a percentage
- Cost Threshold — when a single execution's cost exceeds a dollar amount
- No Activity — when no executions occur within a time window
- Error Count — when errors exceed a count within a time window
Log Retention
- Free Plan: 7 days of log retention
- Pro Plan: 30 days of log retention
- Team Plan: 90 days of log retention
- Enterprise Plan: Custom retention periods available
Best Practices
For Development
- Use the real-time console for immediate feedback during testing
- Check block inputs and outputs to verify data flow
- Use workflow snapshots to compare working vs. broken versions
For Production
- Monitor the Logs page regularly for errors or performance issues
- Set up filters to focus on specific workflows or time periods
- Use live mode during critical deployments to watch executions in real-time
For Debugging
- Always check the execution timeline to identify slow blocks
- Compare inputs between working and failing executions
- Use workflow snapshots to see the exact state when issues occurred
Next Steps
- Learn about Cost Calculation to understand workflow pricing
- Explore the External API for programmatic log access
- Set up Webhook notifications for real-time alerts